An Infographic Timeline
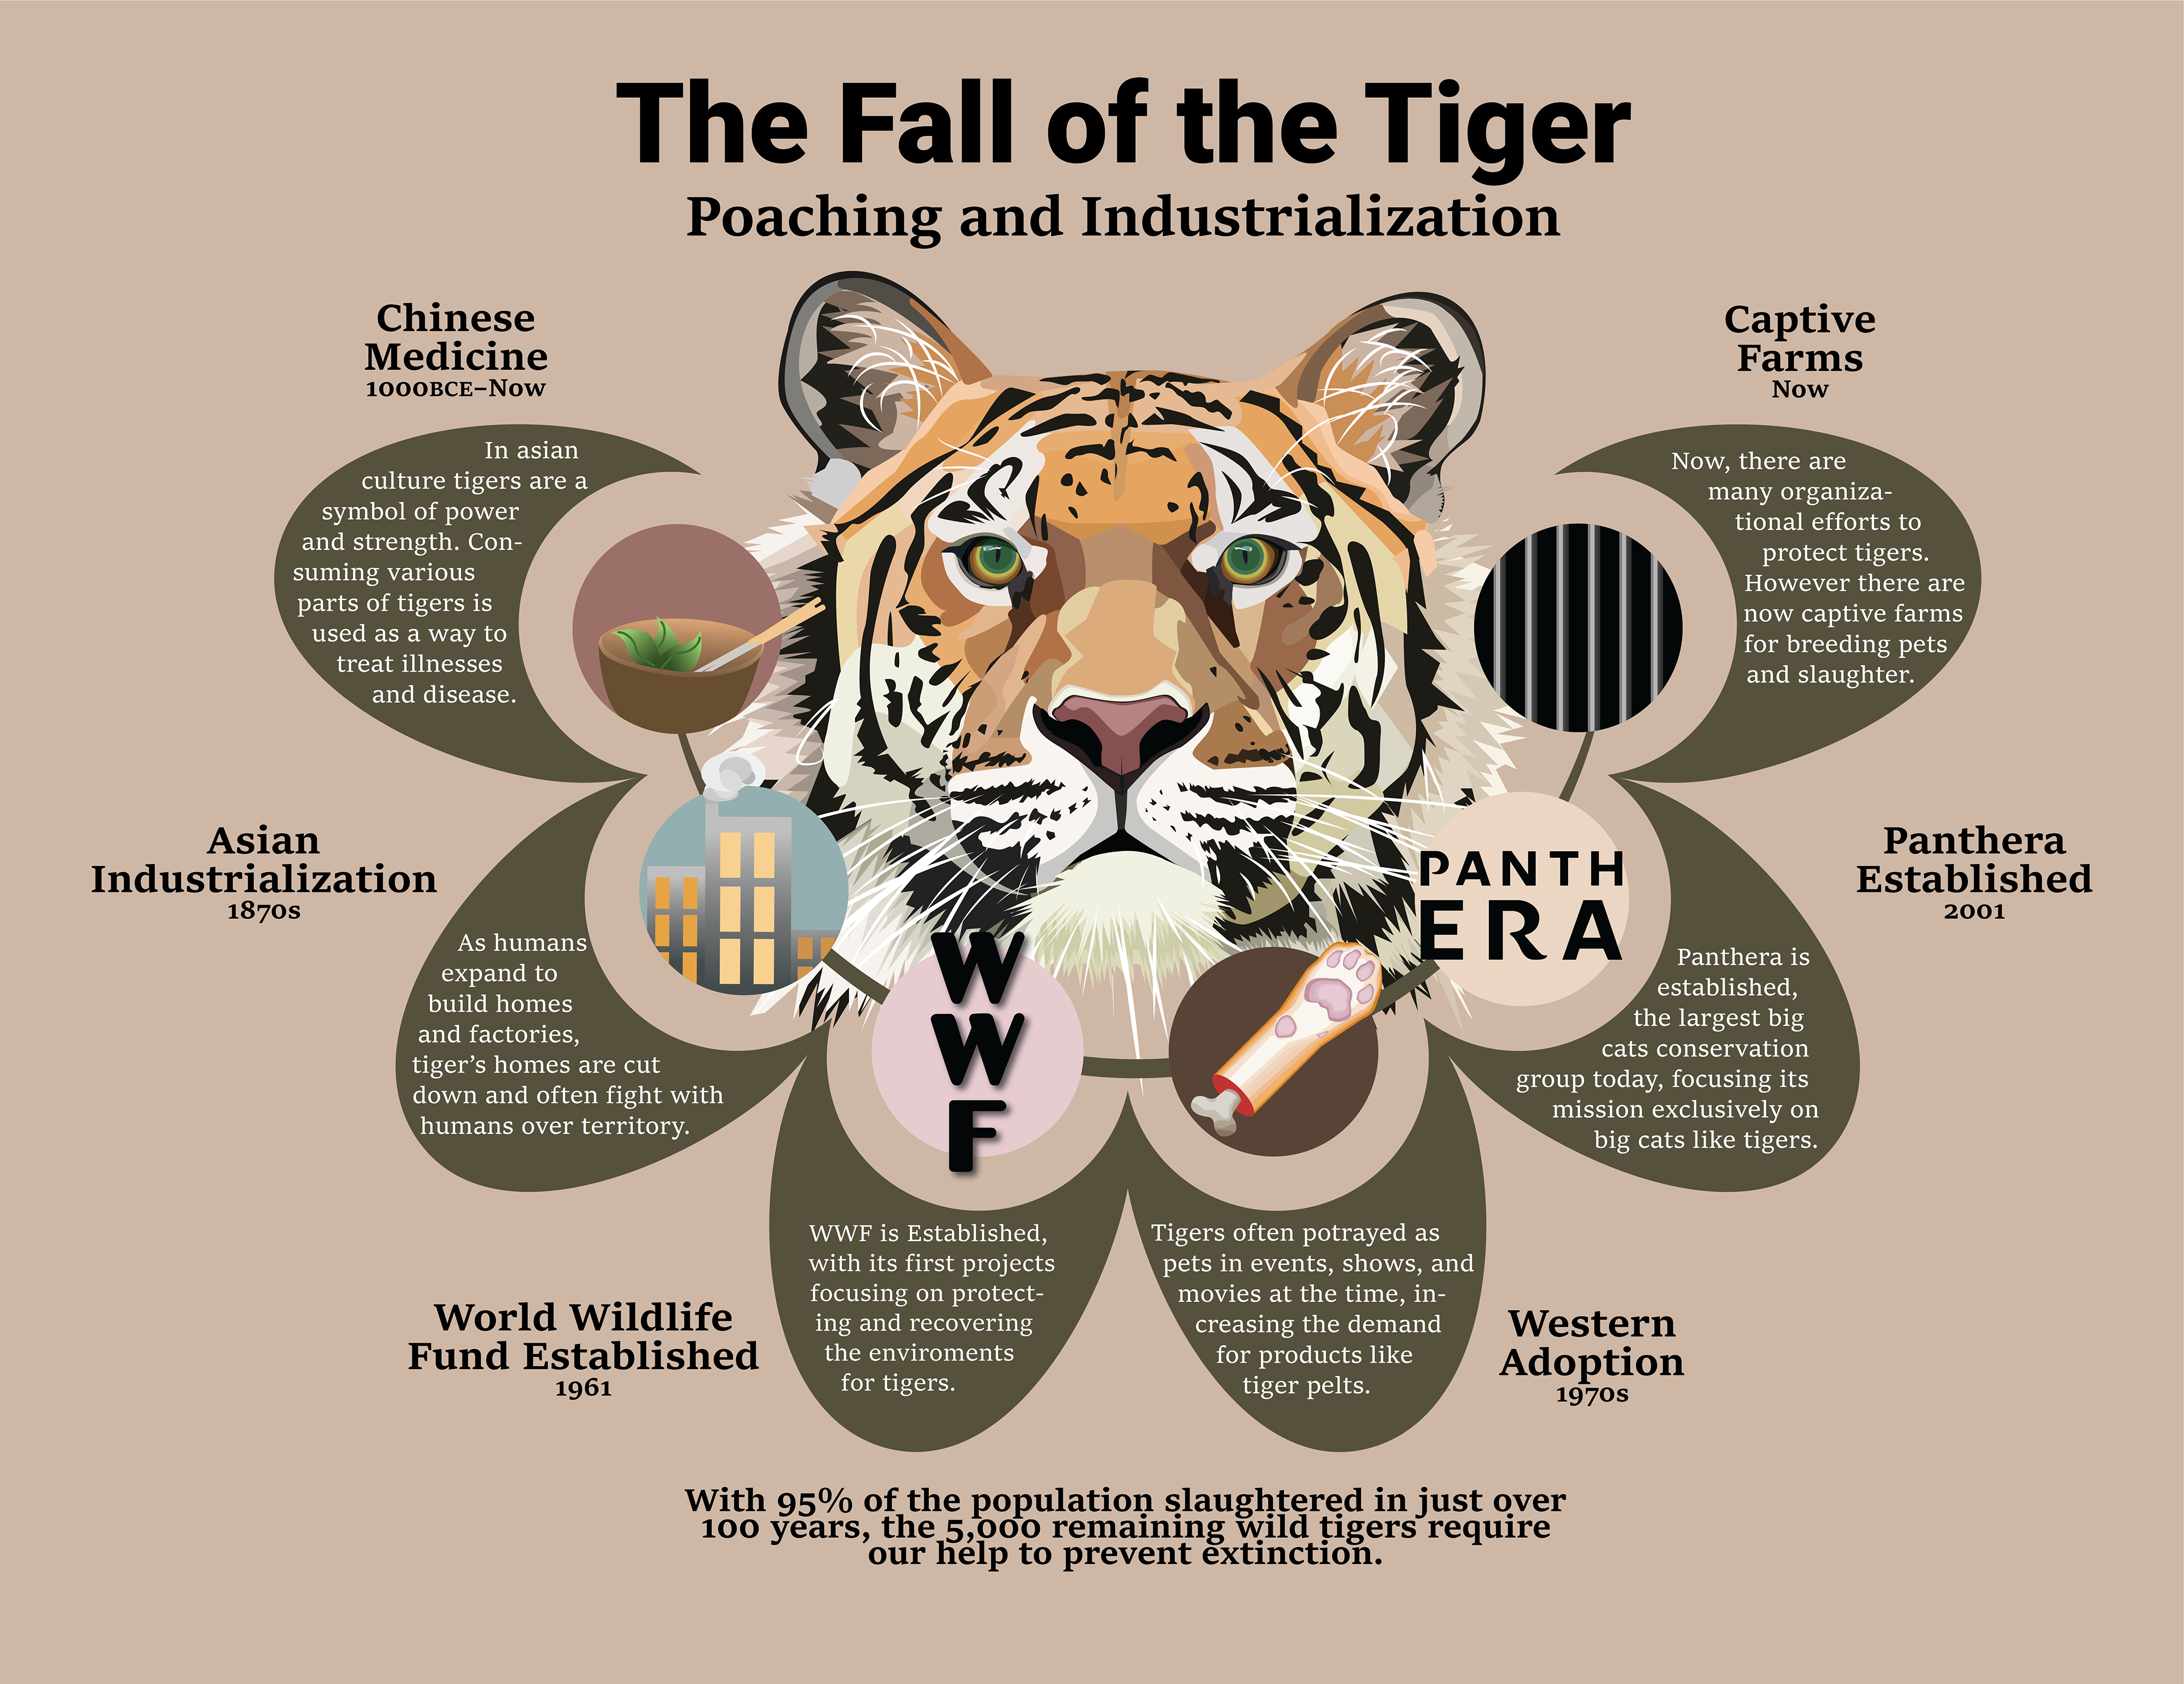
This project started with a prompt: Design an infographic timeline that's subject is either organic or mechanical to show progression over time.
First, I brainstormed different Ideas, doing research on all three. The three ideas were: car safety over time, progression of engines, and what I ended up choosing, tiger populations over time.
I ended up choosing tiger populations over time, as Rochester Institute of Technology both staff and student body would be a great target audience for this poster. The tiger at RIT is a symbol of strength, pride, and courage, all of which would invoke empathy in the target audience.
Sketches
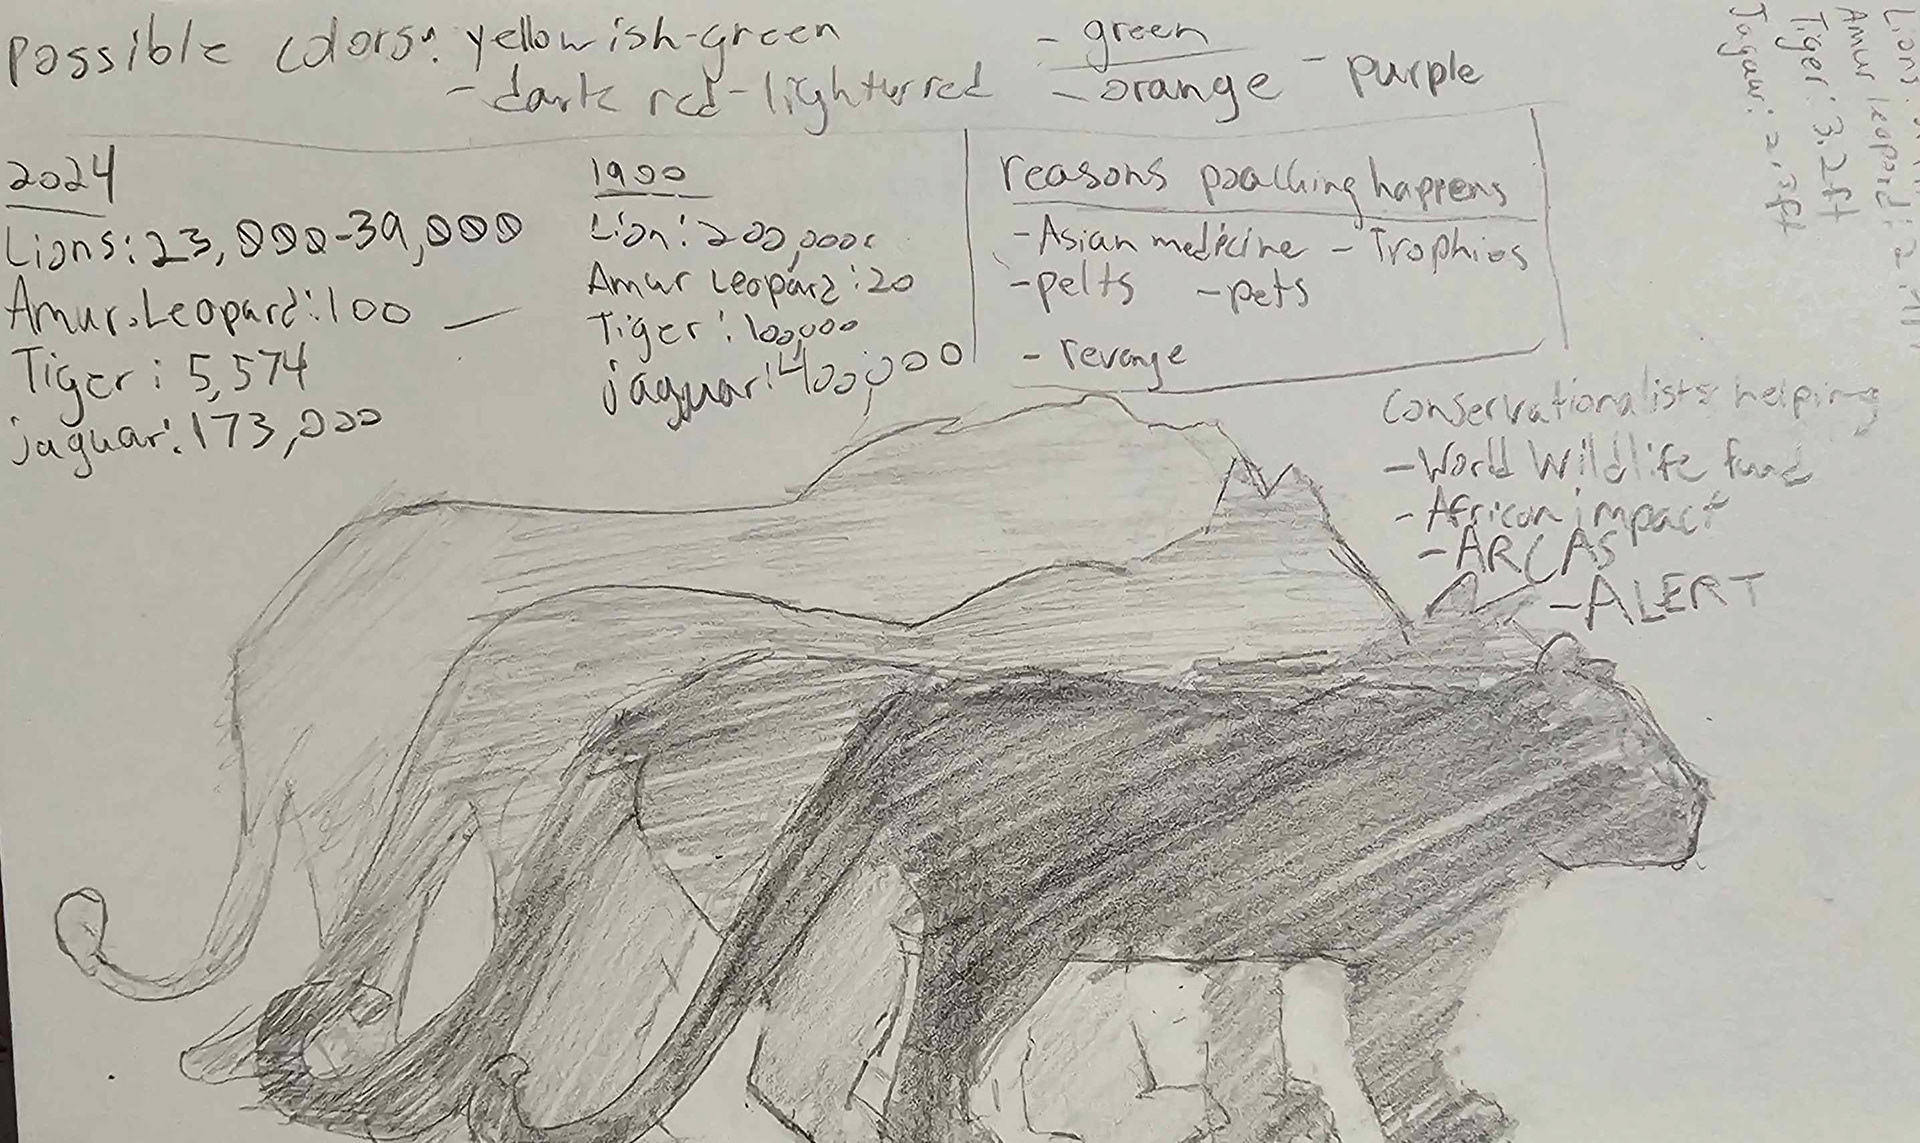
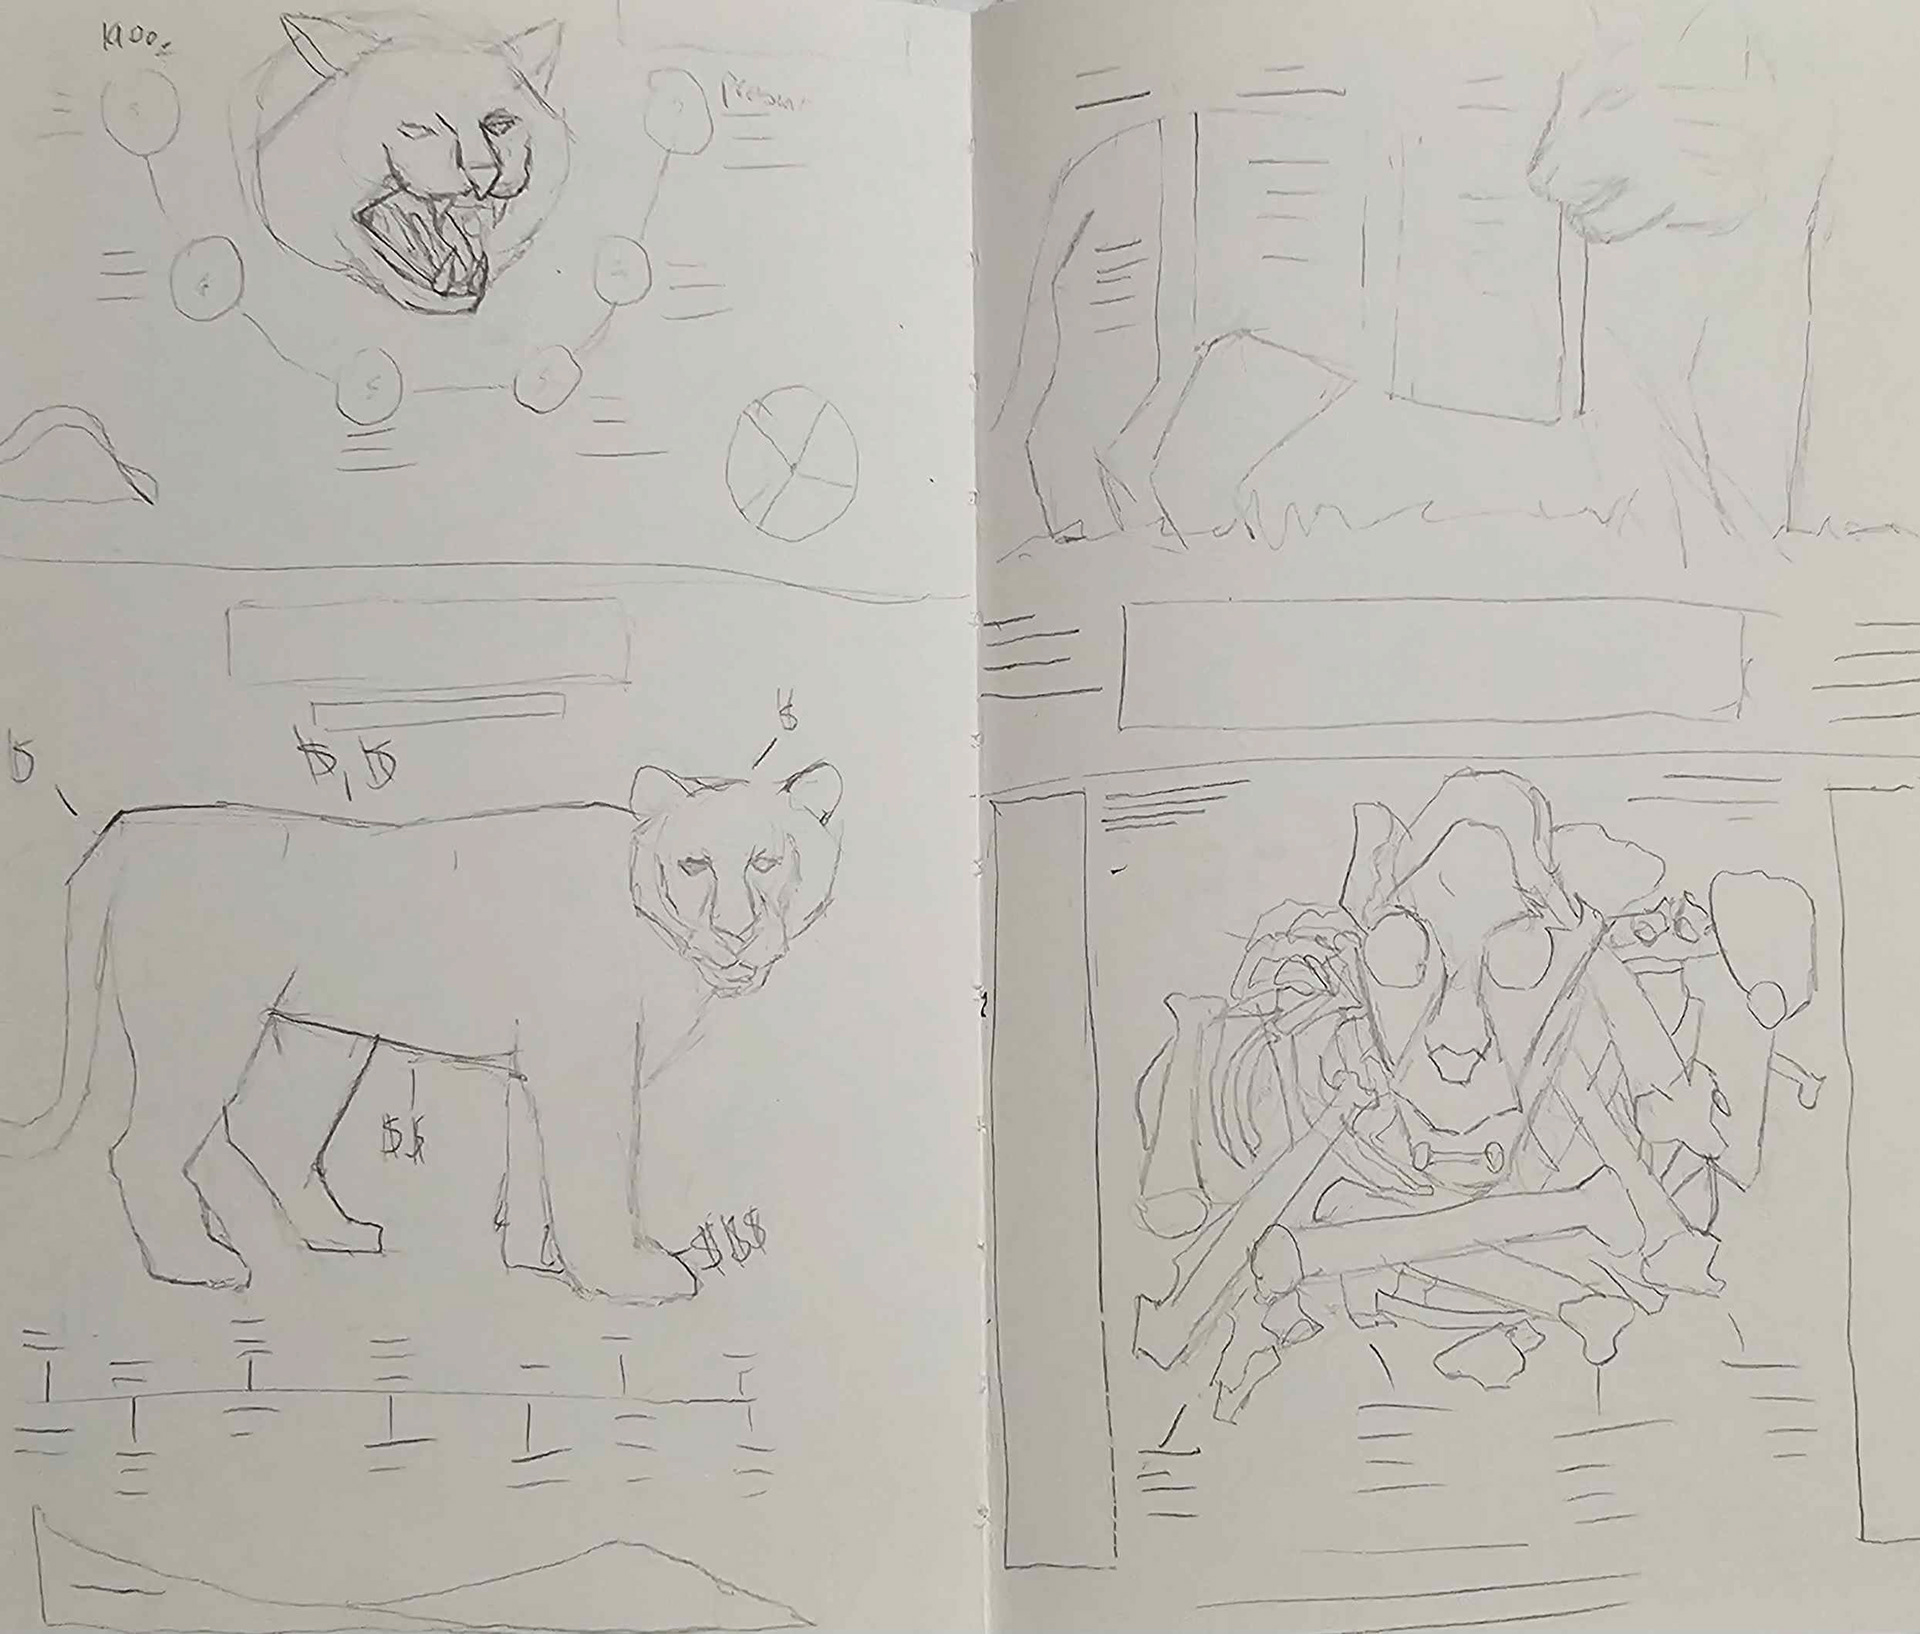
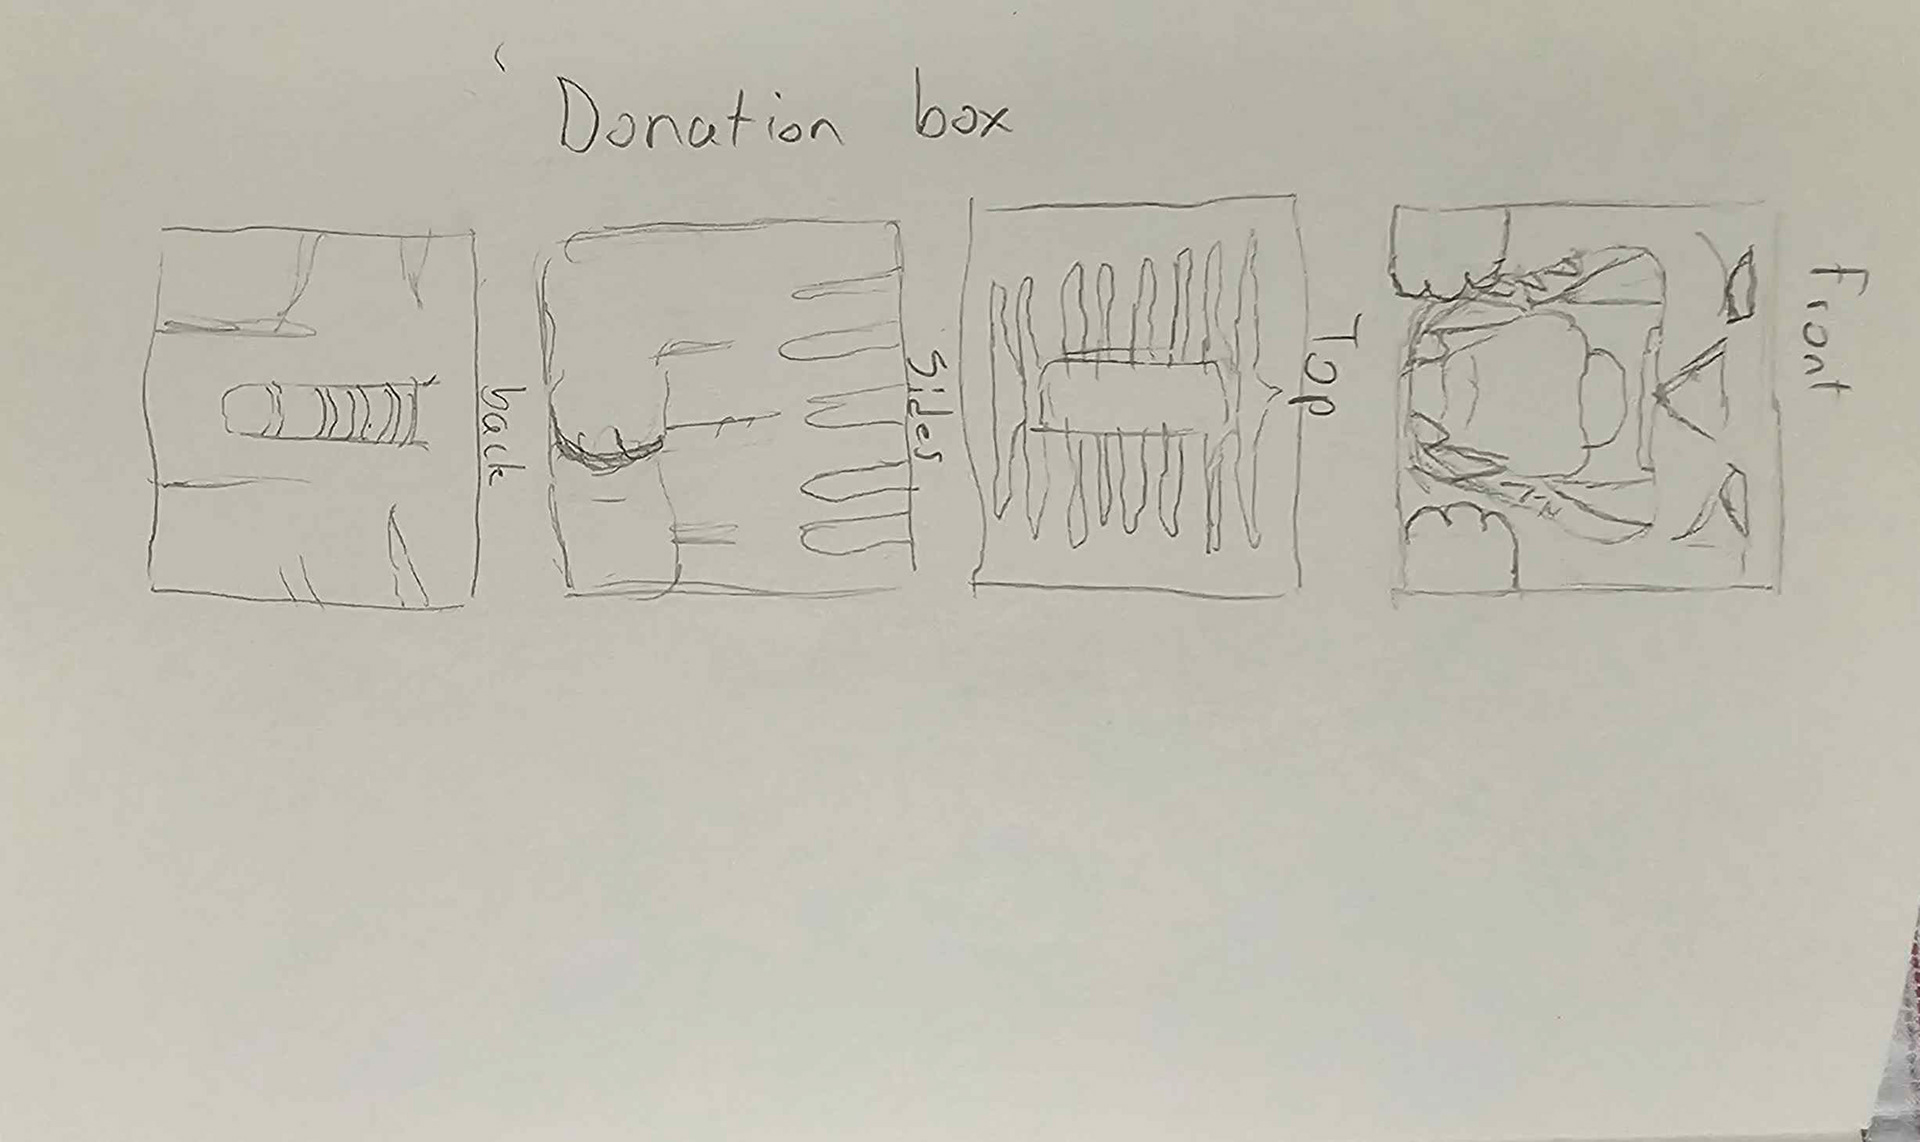
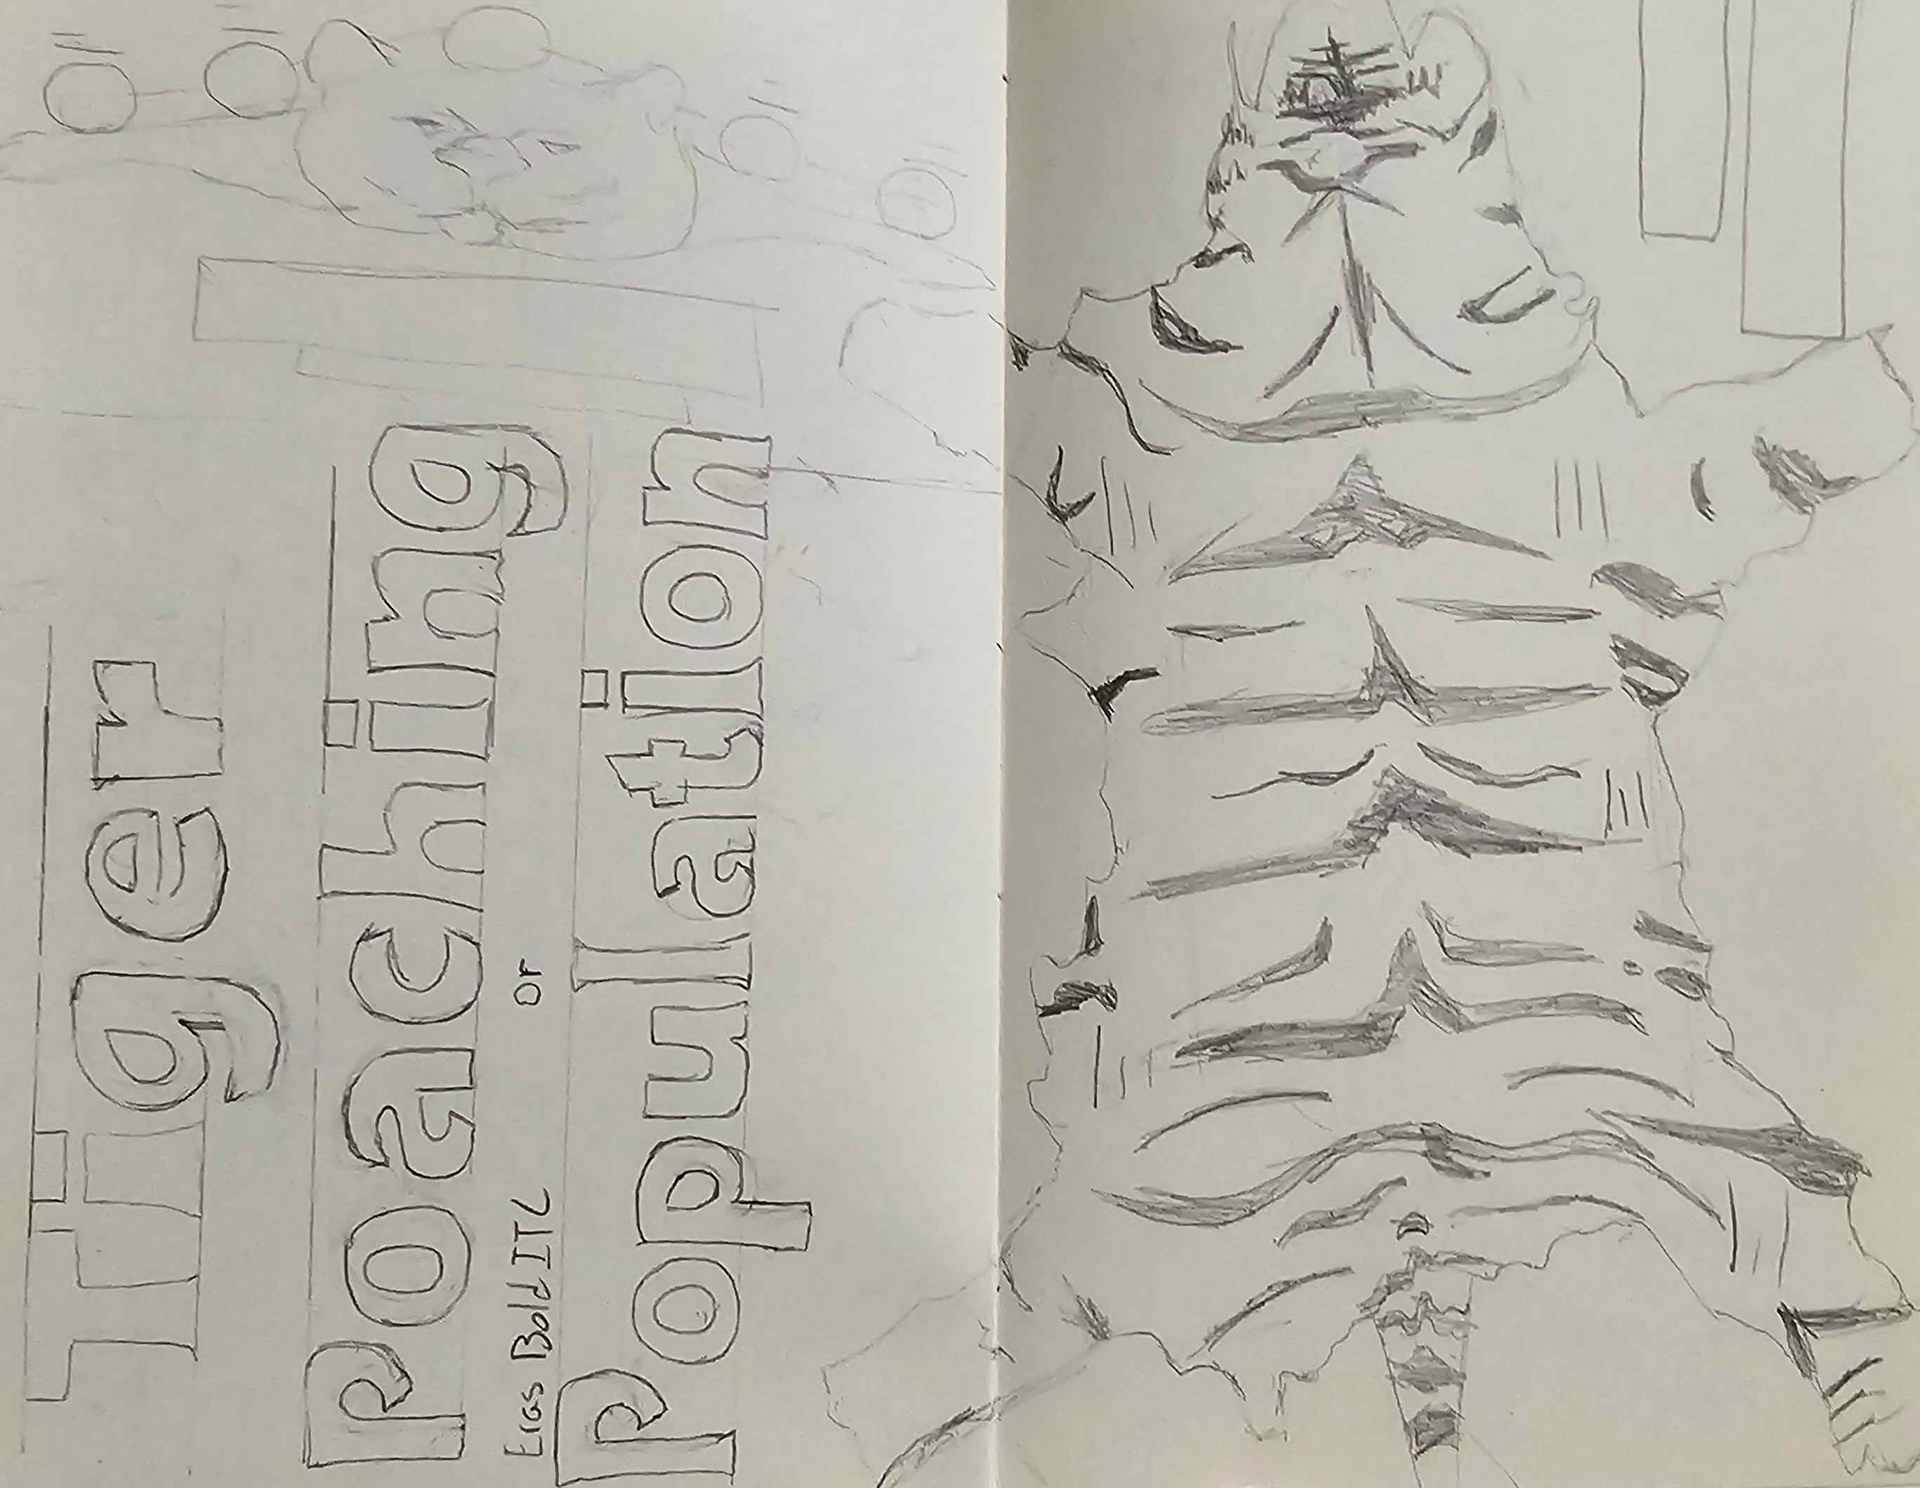
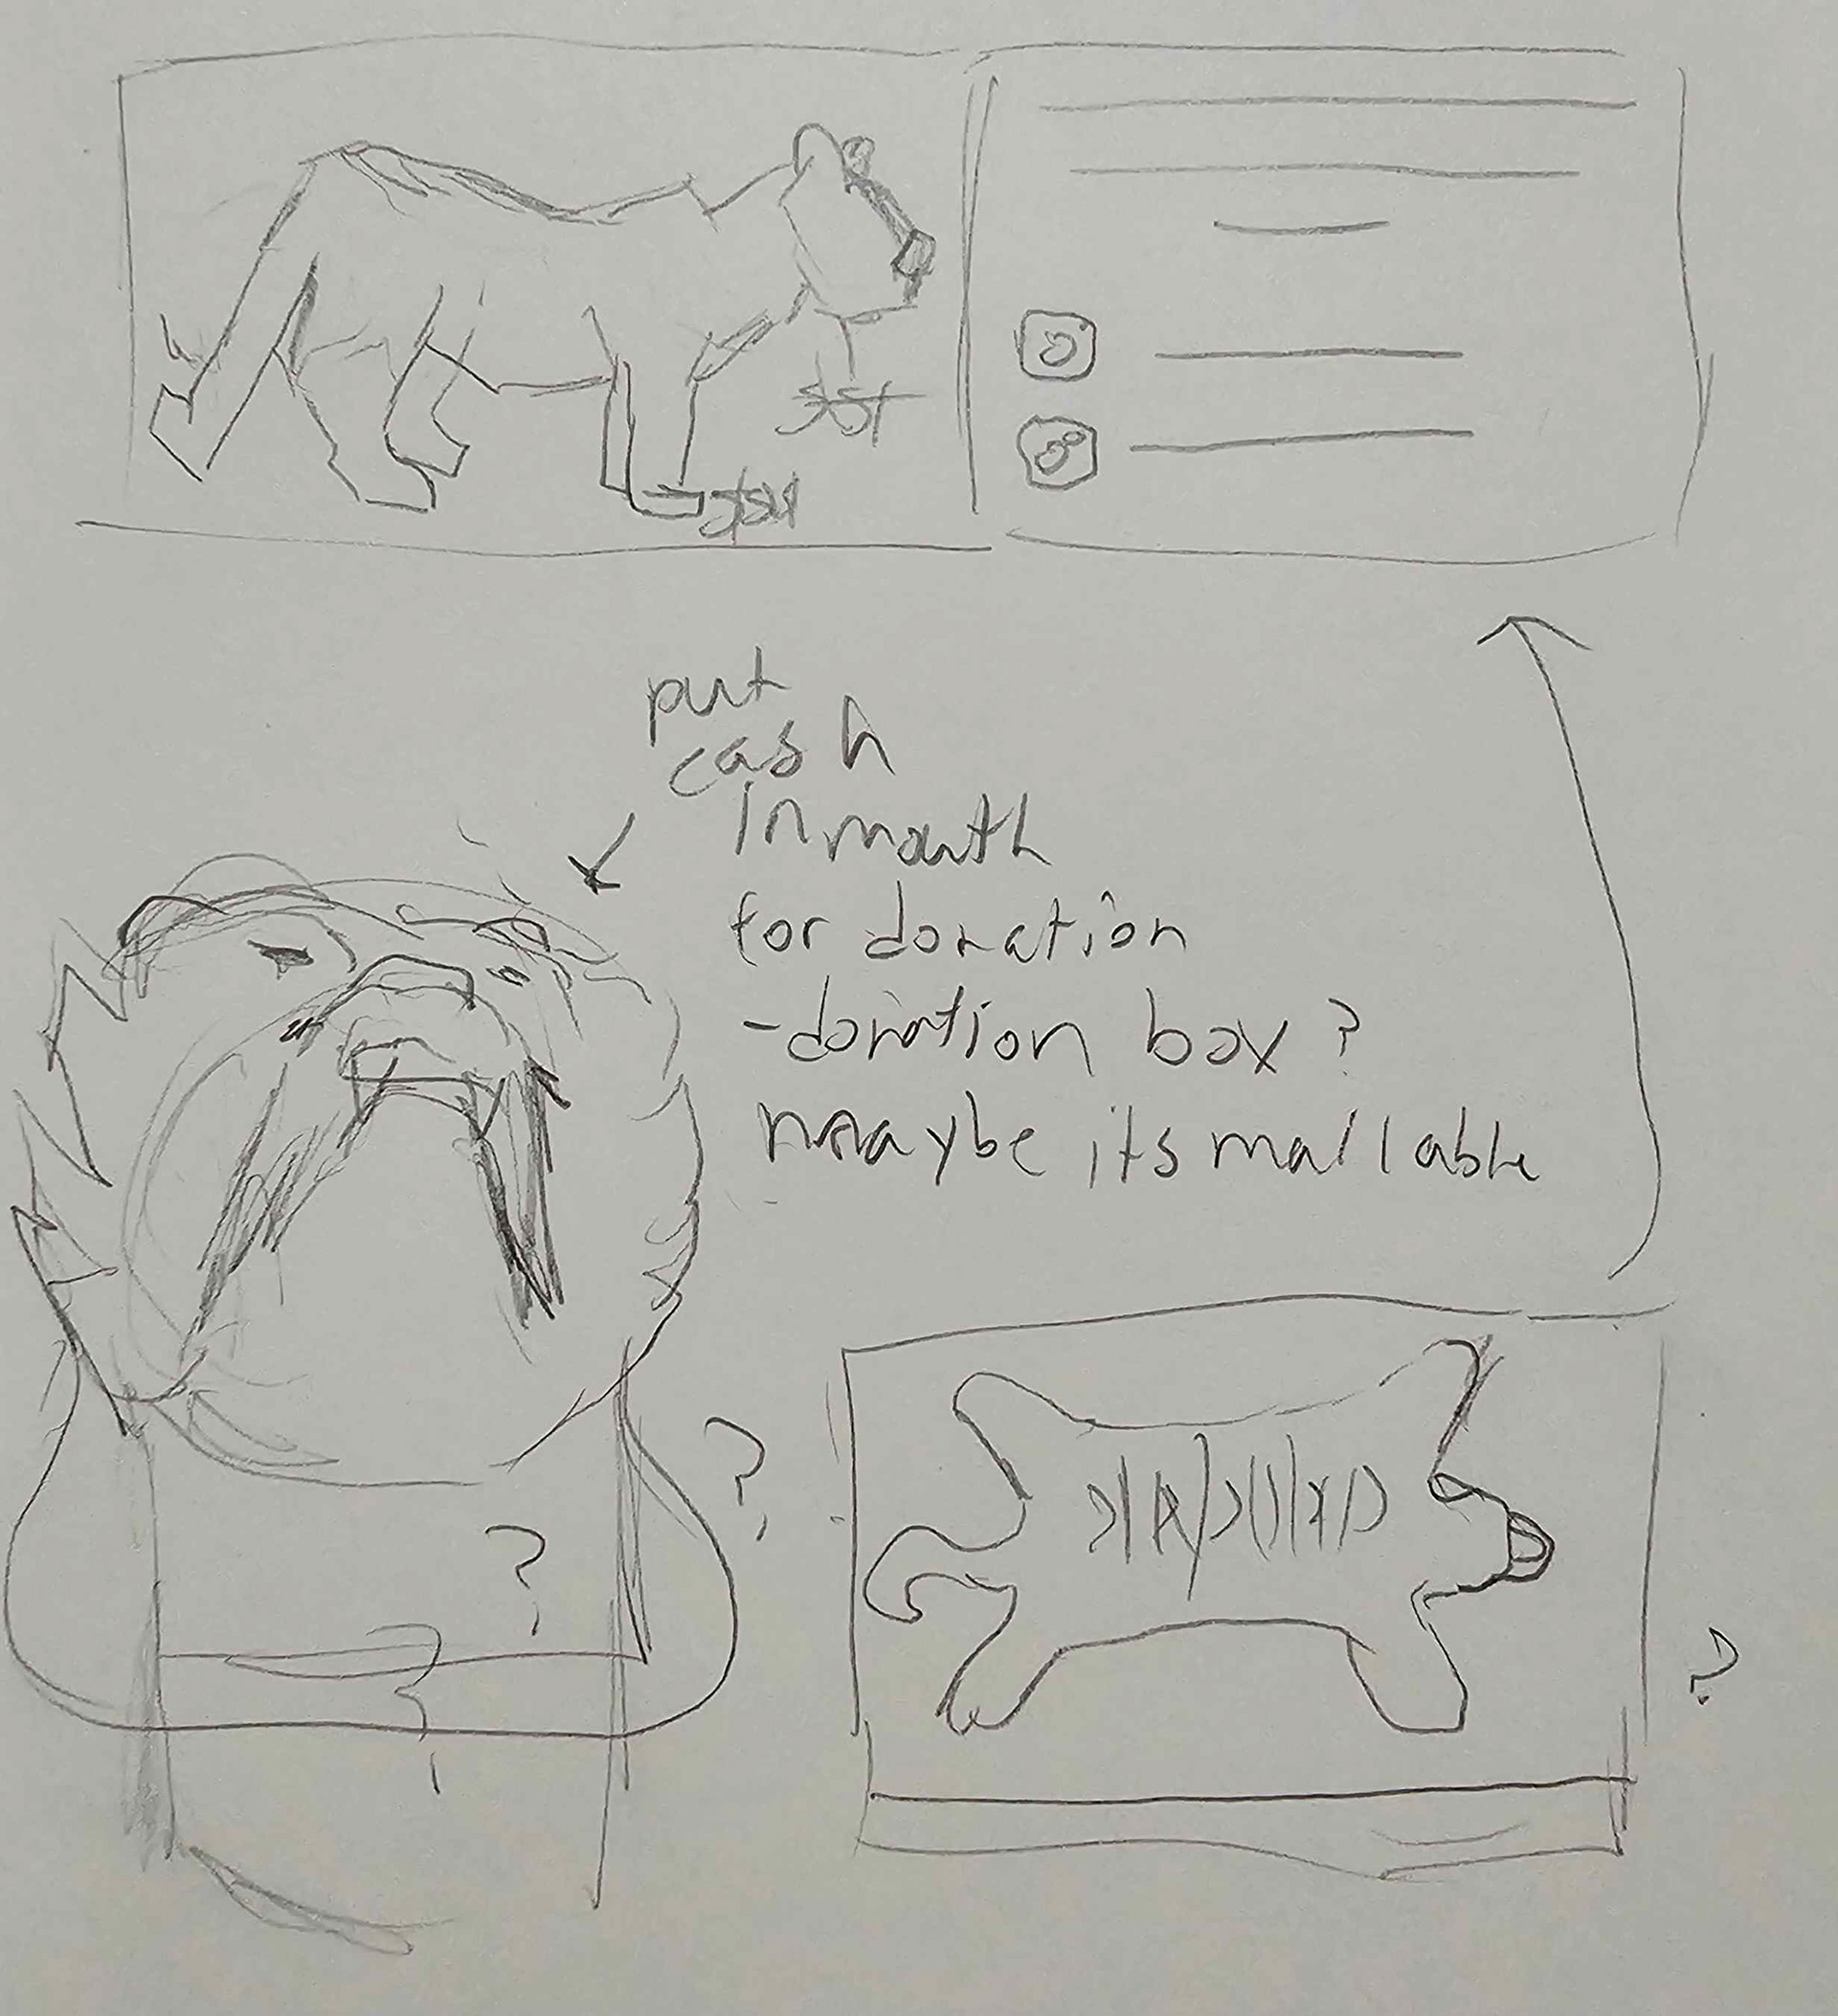
For the sketches, originally I had thought of comparing the tiger to other big cat populations over time, however I felt this undermined and the tiger and focused on all cats as a whole so I scrapped this idea.
I also tried experimenting with extreme imagery, with one of the sketches being a stack of tiger bones to symbolize poaching, however I felt that this never gave the feeling of courage and pride that RIT students are so used to.
In the end, I ended up deciding to focus on the Tiger as a powerful and strong creature, who was being preyed on by humans rather than being weak or inferior.
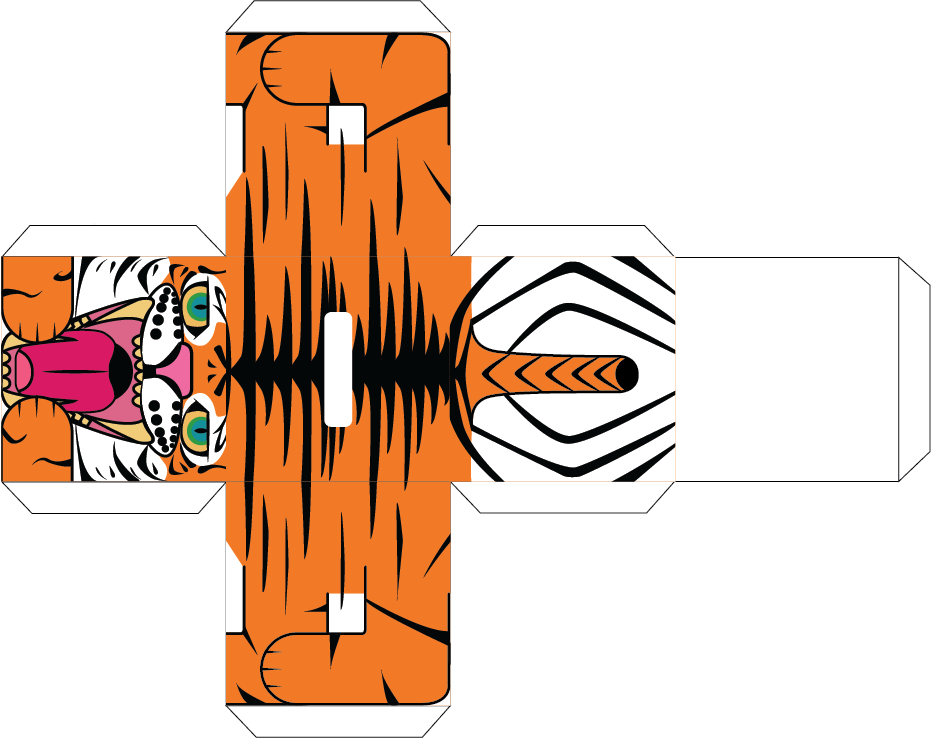
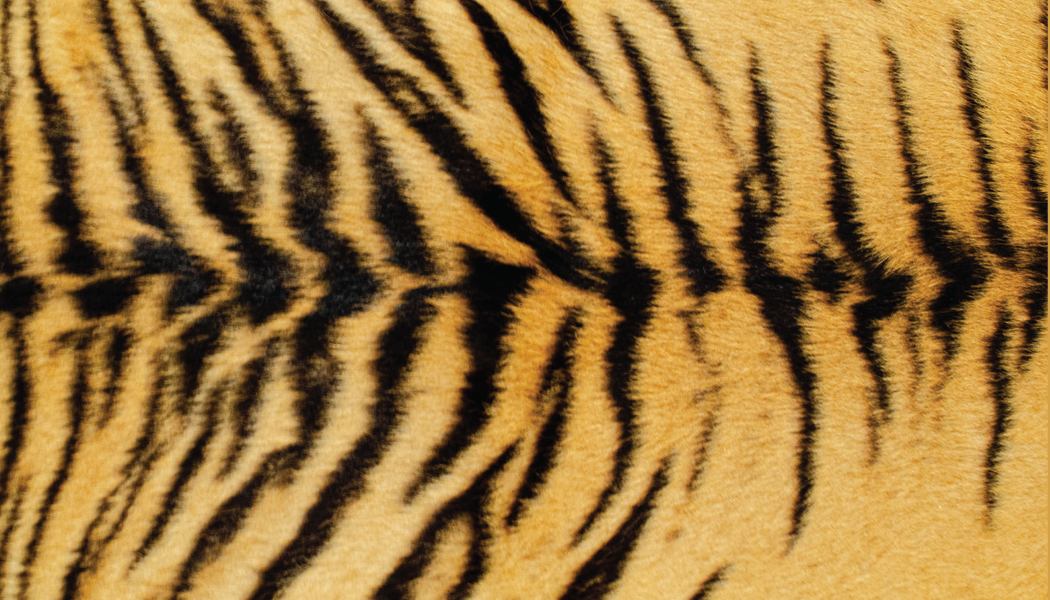
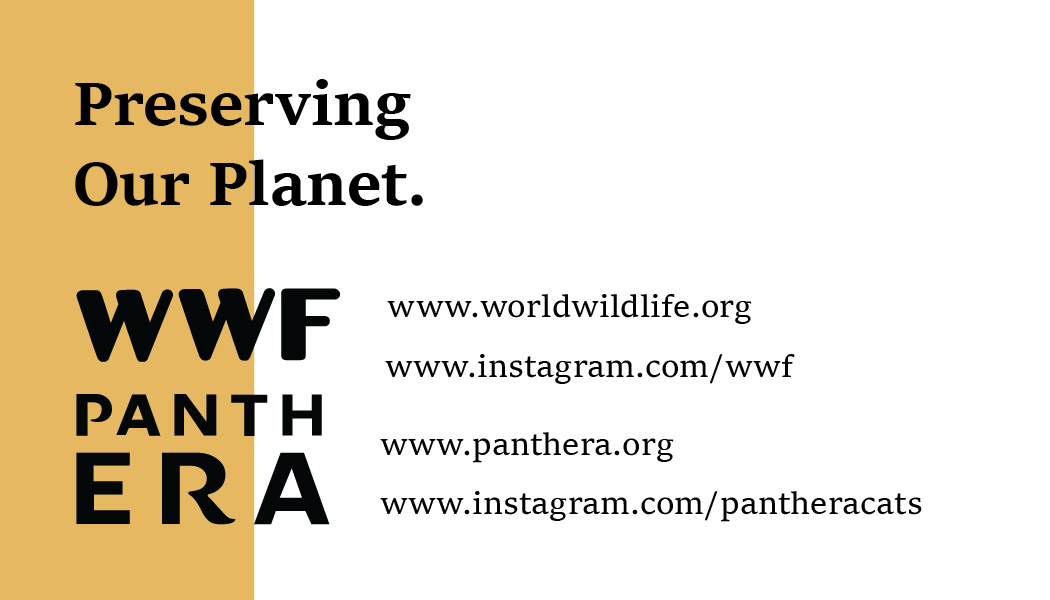
During the sketching process, I scheduled a meeting with the Cary Graphics Arts collection, where they had SpiRIT's pelt, A tiger once owned by RIT for about a year back in the 60's. During this meeting, I was able to photograph SpiRIT's pelt, which I ended up using for the business card for this project.
Design Choices
For this project, I have three deliverables, however they are all feel different from each other. What's the reason for that? Tigers are a species that are across multiple countries, therefore are portrayed very differently culturally. Each piece of this collection was created with this in mind.
